[wptabs mode=”vertical”] [wptabtitle] LAS files[/wptabtitle] [wptabcontent]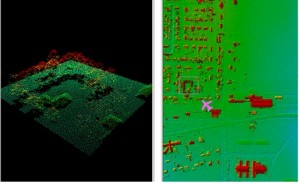 ALS data is now usually delivered in the LAS format. The LAS format specification is maintained by the The American Society for Photogrammetry & Remote Sensing (ASPRS). The current version of the specification is 1.4. These files may be delievered as per-flightstrip or, more commonly from commercial vendors, as a collection of tiles.[/wptabcontent]
[wptabtitle] Metadata and Headers.[/wptabtitle] [wptabcontent]
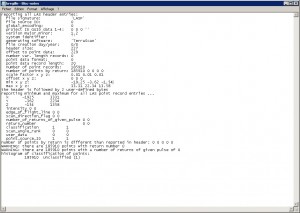
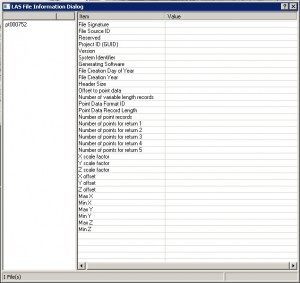
Essential information about the data itself, organization and initial processing of a LAS file is contained in its header. Lidar processing software including LASTools and LP360 will allow you to access the LAS header information. It’s always a good idea to look at the headers to learn things like:
- The software used to generate the file
- The number of returns
- The total number of points
- Offsets and scale factors applied
Many data providers will also supply a detailed project report including information on the project’s error budget, ground control networks, flight conditions, and other technical details. [/wptabcontent]
[wptabtitle] Checking the Point Density.[/wptabtitle] [wptabcontent]Knowing the real resolution of your lidar data is important. Checking that it matches your requested resolution is an essential part of quality control in an ALS project. This information will affect the parameters you select for classificaton and interpolation; It may also influence your expectations regarding the types of features you should be able to identify or accurately measure.
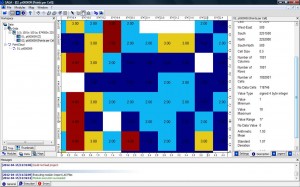
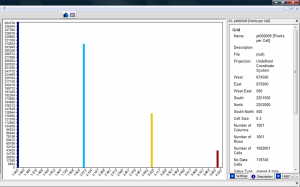
In LASTools you can use the ‘-cd’ or ‘-compute_density’ option in LASInfo to compute a good approximation of the point density for the file. Alternatively, you can use SAGA GIS, an open source GIS software package, to plot per grid cell density and visualize how the densities vary across your dataset.
[/wptabcontent][wptabtitle]Sources of ALS Errors.[/wptabtitle] [wptabcontent]The total error for a lidar system is the sum of the errors from the laser rangefinder, the GPS and the IMU. These sources of error and the calculation of error budgets have been discussed extensively in the literature, including good summaries by Baltsavias (1999) and Habib et al. (2008). For ALS surveys conducted from fixed-wing aircraft platforms, these often total somewhere between 20 and 30cm.
The main sources of error are:
- Platform navigational errors
- GPS/IMU navigational errors
- Laser sensor calibration errors (range measurement and scan angle)
- Timing resolution
- Boresight misalignment
- Terrain and near-terrain object characteristics
Errors may be vertical (along the Z axis) or planimetric (shifts on the XY plane). The errors are obviously related, but they are usually quantified separately in accuracy reports. In commercial applications accuracy analyses usually focus on vertical accuracy, while planimetric accuracy (XY) is secondary.
[/wptabcontent]
[wptabtitle]Types of Errors.[/wptabtitle] [wptabcontent]Both horizontal and vertical errors may be described as random, systematic or terrain dependent. The main source of random error is position noise from the GPS/IMU system, which will produce noise in the final point cloud. These coordinate errors are independent of the flying height, scan angle and terrain.
Systematic errors include errors in range measurement, boresight misalignment, lever arm offset and mirror angle, and some errors from the GPS/IMU system (e.g. INS initialization and misalignment errors and multi-path returns). These errors will appear throughout the dataset. Terrain dependent errors derive from the interaction of the laser pulse with the ojects it strikes. In steeply sloping terrain or areas with off-terrain objects, and at higher scan angles, beam divergence may be increased and result in vertical errors due to horizontal positional shift.
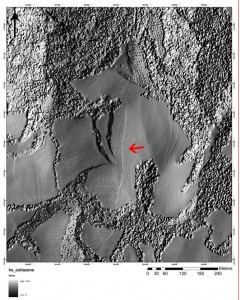
Errors are most visually apparent in areas of strip overlap. A characteristic sawtooth pattern seen in hillshaded DTMs and clear misalignments of planar roof patches seen in the profile are typical of misalignment between adjacent strips.
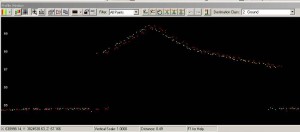
Two scans of the same roofline in two overlapping strips are slightly offset, indicating a slight error. Points coloured by flightstrip.
[/wptabcontent]
[wptabtitle] Classification Errors.[/wptabtitle] [wptabcontent]Lidar data is typically gathered across large areas of the landscape, which may include woodland, urban and arable areas. One of the advantages of lidar over other remote sensing technologies is its ability to ‘see through’ the vegetation canopy, as some returns will pass through gaps in the canopy, reaching and returning from the ground- allowing the creation of a bare earth DEM. To accomplish this data must be classified (or filtered) to separate returns from terrain and off-terrain objects.
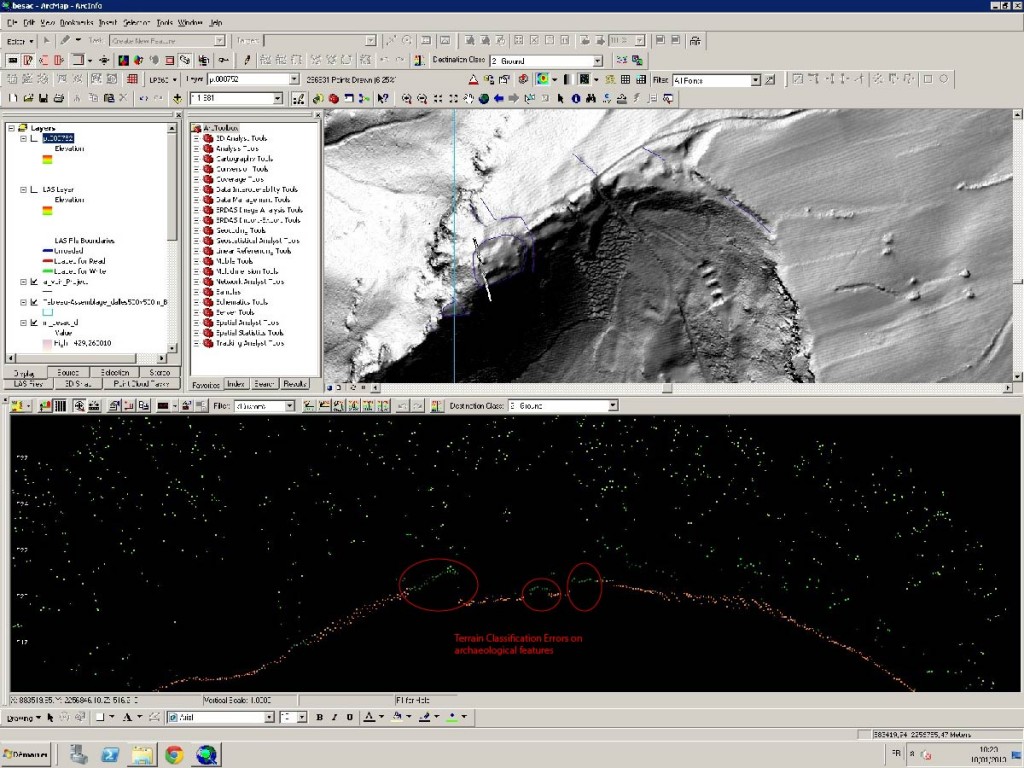
There are a number of algorithms in use for classifying a point cloud. Regardless of the algorithm used, some errors will be committed. Two types of classification errors occur when performing a classification: the removal of points that should be retained (type 1) and the inclusion of points that should be removed (type 2). Overly aggressive algorithms or parameter settings have a tendency to remove small peaks and ridges in the terrain and to smooth or flatten the ground surface. Conversely, insufficiently aggressive parameters will induce the inclusion of clumps of low vegetation returns in the ground class, and can result in false ‘features’ [/wptabcontent] [/wptabs]
