This document will introduce you to some of the initial issues involved in evaluating the overall scope of a project as it relates to data collection.
Hint: You can click on any image to see a larger version.
[wptabs style=”wpui-alma” mode=”vertical”] [wptabtitle] INTENDED AUDIENCE OF THIS GUIDE [/wptabtitle]
[wptabcontent]
Who will find this guide useful?
There are a growing number of digital technologies, including digital photogrammetry and laser scanning, that allow for rapid and accurate documentation of both architectural and other above surface elements. Oftentimes, these technologies complement and enhance traditional survey techniques. There are also a variety of geophysical techniques, such as thermal imaging, conductivity, resistivity, and ground-penetrating radar (GPR), that, in many situations, can provide extraordinarily detailed documentation of the below-surface elements of a site. These techniques can acquire substantial amounts of data in a relatively short time in the field.
By the time that you are reading this, we assume that you are familiar with the technologies on the GMV and the types of applications and projects for which CAST uses them as outlined on the Using the GMV page. You should now also be familiar with the main ideas within the table Survey Options for GMV Technologies. In order to make use of this guide, you need to have a basic to intermediate understanding of these technologies and ideas.
______________________________________________________________
ADDITIONAL RESOURCES : This document, which focuses on issues of project scope as they relate to data collection, is intended to be used in conjunction with the GMV’s Data Objectives Document. It is essential to understand your goals and expectations for final products and file types before any data is collected. Quickly evolving instruments collect such detailed, extensive and large datasets, that specific choices must be made early in the project to coincide with your processing resources and overall objectives. It is suggested that you consider the points in this Project Scope guide in conjunction wit the Data Objective guide as early as possible in the planning process.
The Archaeology Data Service / Digital Antiquity Guides to Good Practice provides much more detail about project planning and execution while this document attempts to simplify very complex topics for a more generalized understanding.
Important Note : Geospatial hardware and software suites are advancing very quickly. These documents aim for a more generalized approach to projects and data options versus a comprehensive guide to specific software choices. Workflows and specific hardware and software suites are referenced based on CAST researchers’ access to and experience with these resources.
So, you are now at the point that you are ready to use one or more of these technologies in your project!
[/wptabcontent]
[wptabtitle] OBJECTIVE [/wptabtitle] [wptabcontent]
Goal of this Guide
It is critical to note that the processes described here focus ONLY on the collection of data and the limited processing of that data necessary to make it ready for an archive and intelligible to others. The primary objective of this document is to provide a source of guidance on the various different methods and technologies that are possible and where and when such techniques are usually most effective. It aims to aid users in evaluating which technologies are appropriate by considering :
I. Distance, Scale and Resolution of Data
II. Which technologies are appropriate for which characteristics of the site or feature(s) of interest
III. The physical and temporal access that is available to the site/object
Disclaimer: Some factors, such as the physical size of the site(s) and/or object(s) that you are documenting, immediately suggest which technologies and methods might be used and which would generally be avoided. However, all projects are different – experiences, unique needs and specific situations often decide which technologies are appropriate.
[/wptabcontent]
[wptabtitle] DISTANCE, SIZE, DATA RESOLUTION[/wptabtitle] [wptabcontent]
How are distance, size of features and data resolution related?
As the Survey Options for GMV Technologies table and sometimes the name of the technology indicates, the ranges in the distance between the feature being surveyed and the piece of equipment surveying it, begins to decide which technologies will work in which situations. Oftentimes sites involve multiple ranges and strategies for combining different types of data must be used.
Once you identify the ranges in distance involved in your project and the size of the feature(s) that you wish to survey, you should have a good idea of what types of technologies will work for your project. Once you know which technologies you are considering, you will have a good basis for identifying what resolution of data is possible and what resolution is needed to document those feature(s) in a way that will provide you with the information that you need.
So basic questions at the beginning of a project should include:
I. Range in Distance and Size of Features:
1. What are the ranges in distance involved in your project?
2. What is the size of the smallest feature of interest? The largest?
3. What resolution do you need in your data to document these features?
[/wptabcontent]
[wptabtitle] RANGE OF DISTANCE [/wptabtitle] [wptabcontent]
What is the range of distance(s) between the feature(s) being surveyed and the equipment surveying it?
Long-range : For the 3D terrestrial scanners referenced on the GMV, ‘long-range’ typically refers to distances between 50 – 500 meters. However, there is some overlap between mid and long-range scanning depending on the equipment being considered. The Optech ILRIS has a minimum distance of 3 meters, for example, but a mid-range scanner would typically be used at this range (depending on the specific situation). Similarly, the Leica C10’s specifications list an effective scanning range up to 200 meters depending on the desired resolution, atmospheric conditions and the reflectivity of the surface being captured and deciding between the C10 and the Optech at this distance would, again, depend on the situation. (See the slide in this guide regarding Qualities of Features for more information on surface reflectivity).
NOTE: When considering long-range 3D scanning, beam divergence must also be considered. At greater distances, the diameter of the laser beam itself affects the density of points that may be captured across a surface. Consult specifications for individual scanners for more details on how range and beam divergence relates to data resolution.
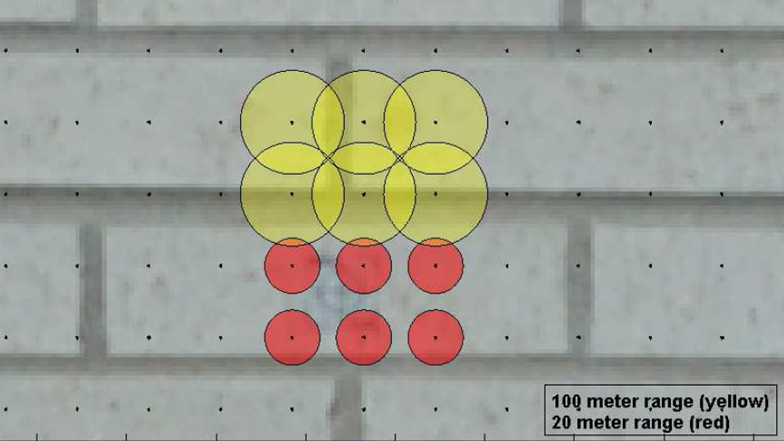
Yellow shows the diameter of the Optech’s beam at 100 meter range. The red shows the same beam at a 20 meter range
For distances greater than 500 meters and for expansive sites, airborne laser scanning (LiDAR) or traditional aerial photogrammetry are usually the preferred options. Survey Grade GPS may be an important component when surveying sites involving long-range distances as it allows you to relate extensive sites, dispersed features of interest, multiple technologies/setups and even periods of time with global coordinates.
Mid-range : For the 3D terrestrial scanners referenced on the GMV, ‘mid-range’ typically refers to distances between 1 – 140 meters. The effectiveness within this range depends on the scanner being used and, in some cases, on the reflectivity of the surface being captured. Low-altitude aerial photogrammetry and some terrestrial photogrammetery methods might also be used depending on the type of feature(s) being surveyed. For subsurface features, geophysics also becomes an option at this range as in most cases of CAST’s research, surveys explore the uppermost 5 meters of the earth’s surface. Again, GPS may play an important role in tying together a mid-range survey.
Close-range : For the 3D terrestrial scanners referenced on the GMV, ‘close-range’ typically refers to distances between 1 – 5 meters and it is often within 1 meter. At this range, Reflection Transformation Imaging (RTI) and Close-Range Photogrammetry (CRP) also become options. Deciding between scanning or photographic methods depends on whether 2D or 3D information is needed and on the time and resources at your disposal. Physical access to the object(s) or surface(s) also plays an important part in this decision.
[/wptabcontent]
[wptabtitle] SIZE OF FEATURES [/wptabtitle] [wptabcontent]
What is the size of the smallest feature of interest? The largest?
Answering this question in combination with an understanding of the range of distances involved, furthers your ability to identify which technologies are appropriate for your project.
Larger scaled features : If you are interested in surveying standing architectural structures/ ruins and/or interior spaces or rooms, there is a good chance that 3D scanning is a viable option. If you are interested in features within the structure, such as openings, archways, or larger-scaled details, this excludes long-range scanning as an option but it opens up photogrammetric options in addition to mid-range scanning.
Planimetric Features : In long-range scanning and low-altitude photogrammetry, capturing planimetric information for the structure(s) is possible but it is usually dependent on whether there is a covering/roof present and the height of the existing structure (i.e. whether the scan or photo is able to capture the geometry of the wall/ruin at the given distance). Multiple setups from elevated vantage points may help to capture the planimetric details from a distance. Capturing planimetric features is also possible with mid-range scanning, but it highly depends on the ability to tie together multiple scanner setups to form a legible layout of the structure(s). If you are interested in interior planimetric details, the presence of the roof is not typically relevant but access to setup the scanner from these interior spaces is required.
Finely scaled features : If you are interested in 3D information about more finely scaled details, such as shallow inscriptions or tool marks, close-range scanning typically becomes the preferred method of survey. However, if you are interested in less-precise 3D information or 2D information about these details or if you are interested in finely scaled details with very low/no physical relief, then RTI and CPR become reasonable options (note that RTI is restricted to 2D information with virtual 3D effects).
[/wptabcontent]
[wptabtitle] DATA RESOLUTION[/wptabtitle] [wptabcontent]
What data resolution do you need?
In general, when determining the proper resolution for your data, you should identify the smallest feature which you want to survey and the accuracy of the piece of equipment that you are using. Data resolution has different meanings as it is applied to different technologies.
In 3D scanning, resolution is defined as the average distance between the x, y, z coordinates in a point cloud. This is also called point spacing. In photographic methods, resolution is based on the dimensions of a pixel within the image.While it is tempting to simply say that you want the highest and most dense resolution that the technology will allow, it is important to realize that the higher the resolution the larger the file sizes and often, the longer the collection and processing times that are involved. For more detailed information on how resolution as it relates to heritage projects, see Archaeology Data Service / Digital Antiquity Guides to Good Practice
In Geophysics and GPS the accuracy of the data is often a more relevant consideration than the resolution of the data collected.
[/wptabcontent]
[wptabtitle] SITE/OBJECT CHARACTERISTICS [/wptabtitle] [wptabcontent]
Which technologies are appropriate for which characteristics?
While all sites and situations are different, there are some qualities that, if present, make certain survey methods more preferable than others. Deciding which technologies to use is largely based on characteristics of the site and/or object(s) and what type of information is needed. See the Survey Options for GMV Technologies table for a summary of the typical uses and abilities for the technologies at specific ranges given certain characteristics.
Common questions about the site and/or object(s) you wish to survey include:
I. Are there darkly colored, highly reflective (mirror-like), and/or translucent surfaces within the site that you want to capture?
II. What is the amount of relief and/or depth in the layer(s) of the surface being captured and what are the angles between these surface(s) and the equipment you are using?
III. Are there features or artifacts scattered across the site?
IV. Will subsurface features be included in your survey?
V. Is vegetation present on the site?
[/wptabcontent]
[wptabtitle] DARK, REFLECTIVE, TRANSLUCENT SURFACES [/wptabtitle] [wptabcontent]
Darkly colored, highly reflective (mirror-like) and translucent surfaces : All of these qualities affect the way in which 3D scanners interact with the surface being scanned, as does the smoothness or roughness of the surface.
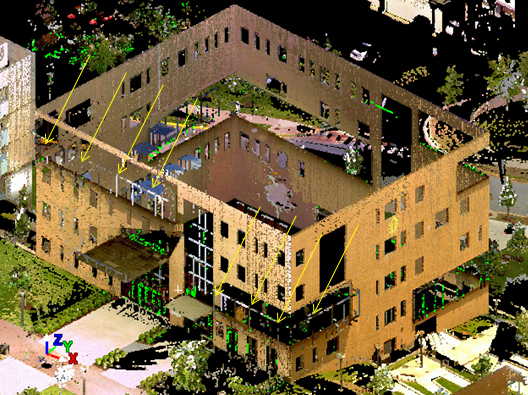
The yellow arrows indicate where the building’s black-colored windows should be. These darkly colored and translucent features were not captured with laser scanning.
The ability to collect surface data using a laser scanner (and the range at which it can be collected) is partially determined by the properties of the surface that is being recorded. In general terms, darkly colored surfaces absorb the laser beam while smooth, highly reflective (specular) surfaces reflect the beam at an angle equal to the incoming incidence angle (i.e. not back toward the scanner). Translucent surfaces partially transmit and diffuse laser beam. In all of these cases, the laser beam returning from surface can be extremely weak or nonexistent. If these surface qualities are very common within your site/feature(s) of interest, 3D scanning is probably not a good choice. However photogrammetric methods may be an option.
[/wptabcontent]
[wptabtitle] DEPTH & ANGLES OF THE SURFACE [/wptabtitle] [wptabcontent]
Angles of incidence, amount of relief/and or depth in the layer(s) within a surface :
Angles of Incidence: In terms of laser scanning, the angle of incidence is the difference between a perpendicular angle to the surface and the angle between the laser beam and the surface. Ideally, the laser should be perpendicular to the surface (i.e. the angle of incidence is 0°). The less perpendicular the laser and the surface are (i.e. the larger the angle of incidence) the more oblique and unreliable the data becomes. For example, scanning a building from the corner only would mean that the laser is not perpendicular to the walls of the building at any point, except the corner. The points on each wall would splay/widen as distance increases. So a flat wall would not have a regularized, gridded set of points to measure or analyze. While scanning a building’s corners is helpful in tying multiple scans together, if you are seeking accurate measurements on the walls, it is highly recommended to scan the walls from a perpendicular vantage point.
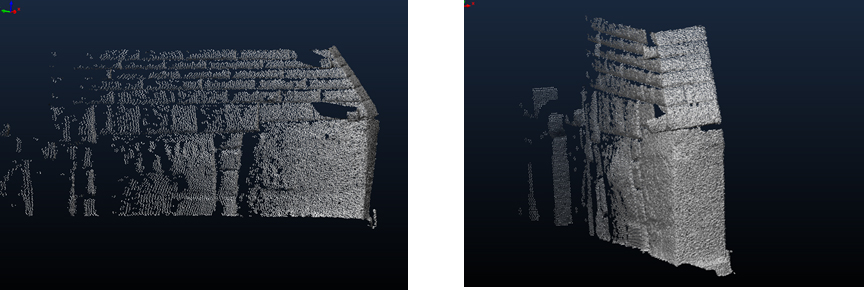
Left shows a stone wall scanned from a perpendicular angle; points are gridded evenly across the surface. Right shows the same wall scanned with a high angle of incidence. The density of the points changes as the distance and angle increases.
Relief & Depth within the Surface : The angle of incidence is especially important when considering surfaces that are highly detailed with multiple layers of relief. Multiple scanning positions are required to capture details reliably and depending on physical access and the size of the features, it may not be possible to capture all surfaces. Photogrammetric and RTI options may allow for greater flexibility and physical access to address some of these issues, although capturing all sides of highly complex, deeply recessed surfaces is problematic for any method.
[/wptabcontent]
[wptabtitle] SCATTERED OR SUBSURFACE FEATURES, VEGETATION [/wptabtitle] [wptabcontent]
Additional Qualities to Consider
In addition to the issues already discussed in detail in the previous slides, some other general questions that should be considered early in your planning process include:
Are there features or artifacts scattered across the site?
When features or artifacts are spread out across a site (i.e. single features or small areas of features are spread over significant distances) 3D scanning, CPR and RTI may be good options to record geometry and surface details. However, it will be difficult to relate the features to one another and to the greater site using these methods. In these cases, low-altitude photogrammetry and GPS are the preferred methods for tying together individual features or areas. If highly detailed geometric or surface information is needed, scans and/or photos can be tied together using GPS. If such highly detailed information is not needed, you can use GPS alone to record precise locations with specific semantic information (i.e. description of the ruin)and lower resolution geometric information (i.e. centimeter resolution outline of the perimeter of the ruin).
Will subsurface features be included in your survey?
If you are interested in features below the earth’s surface, utilizing geophysics becomes one of the primary methods used without actual excavation. At CAST, this type of survey usually focuses on the uppermost 5 meters of the earth’s subsurface. Oftentimes using geophysics in your survey can help you to identify and to prioritize areas for future research.
Is vegetation present on the site?
Vegetation can be problematic for a variety of reasons. To start, it can cover or obstruct features of interest so that scanning and photographic methods cannot properly record the surfaces themselves. A second problem caused by vegetation is its tendency to move. Changes in wind from one scan/photo to the next can cause serious problems when trying to align overlapping areas in which the human eye may be unable to identify the same point/area or in which the software may become confused over these multiple moving points.
Strategies for dealing with Vegetation : There are strategies for dealing with vegetation while collecting data, such as using the last laser return from a scanner vs. the first return (i.e. considering the last return to be the point at which the laser encounters the surface and considering the first return as the point at which the laser encounters the vegetation). Another strategy is to plan the survey during late fall/winter seasons when vegetation is at a minimum. There are also strategies for minimizing the impact of vegetation during processing, such as removing the tops of all trees before aligning scans.
[/wptabcontent]
[wptabtitle] PHYSICAL & TEMPORAL ACCESS [/wptabtitle] [wptabcontent]
Physical and Temporal Access to the Site
Temporal : It is difficult to estimate typical time frames for collecting data over a given area with a specific technology. Previous experience with the equipment and processes and the number of people on the site throughout the project greatly affect how long it will take to document a set of objects or sites. Other considerations include:
Time of day and year that you have access to the site (i.e. hours of daylight if daylight is needed).
Speeds of the specific equipment that you are using must be considered. With 3D scanning, there are significant differences in collection times depending on the scanner itself.
Transition time between setups often takes up a major portion of the overall time whether setting up for scans, photographs, or other methods of survey.
Weather, traffic and tourists are just a few of other interferences that might delay or change the course of data collection and should be considered specifically to your site.
Leaving a leeway/margin of time within the schedule is highly recommended (a minimum of roughly 1/3 the overall time is a good place to start).
Including processing time in field time is also highly recommended. Processing each day’s data as soon as possible, and if possible, before leaving the site can help you identify missing or corrupted data that cannot be replaced once you leave the site. Processing over a lunch break or when returning from the field each night is almost always worth the time.
Setting Priorities : Taking possible mishaps and delays into consideration, enter the site with a clear set of priorities.
What are the main objectives in the survey? What is essential to capture and what is secondary?
What is the total number of structures and/or features to be surveyed?
What resources (equipment, people) do you need to capture each survey objective? Arriving at the site prepared might make the difference between getting all of the data that you need or none of the data that you need.
Terrain : Many heritage sites are located ‘off the beaten track’. When planning the project, consider the total equipment weight, the number of people, and the overall ruggedness of where you will be hauling all of that weight. Have a clear understanding of the requirements for bringing equipment into different countries/regions in addition to knowing shipping and/or airline luggage regulations.
Power, Lighting : Consider power and lighting in your equipment calculation. Is there a power supply at the site? Do you need to haul batteries back and forth? Do you need to supply lighting for some areas/times?
[/wptabcontent]
[/wptabs]